Does a solar battery work in winter? The seasons in kWh
Solar output in a British midwinter is a fraction of midsummer's. A battery fed by panels follows that curve, so it pays to understand it before choosing a size.
In short
It works, but it has far less to store. On PVGIS figures for Leicester, panels make about 3.88 kWh per kWp on a June day and 1.10 in December. In winter most solar is used as it is made, leaving little surplus, so a solar-fed battery often sits near its reserve unless it is also charged from the grid.
June against December
PVGIS, the European Commission's solar estimator, gives monthly output for any location. For a south-facing array at 35 degrees with 14% system losses at Leicester, a June day averages about 3.88 kWh per kWp and a December day about 1.1: roughly 3.5 times as much in midsummer.
Meanwhile, household use barely changes, and often rises in winter with lighting and heating controls. Ofgem's medium single-rate figure, 2,500 kWh a year, is about 6.8 kWh a day across the year.
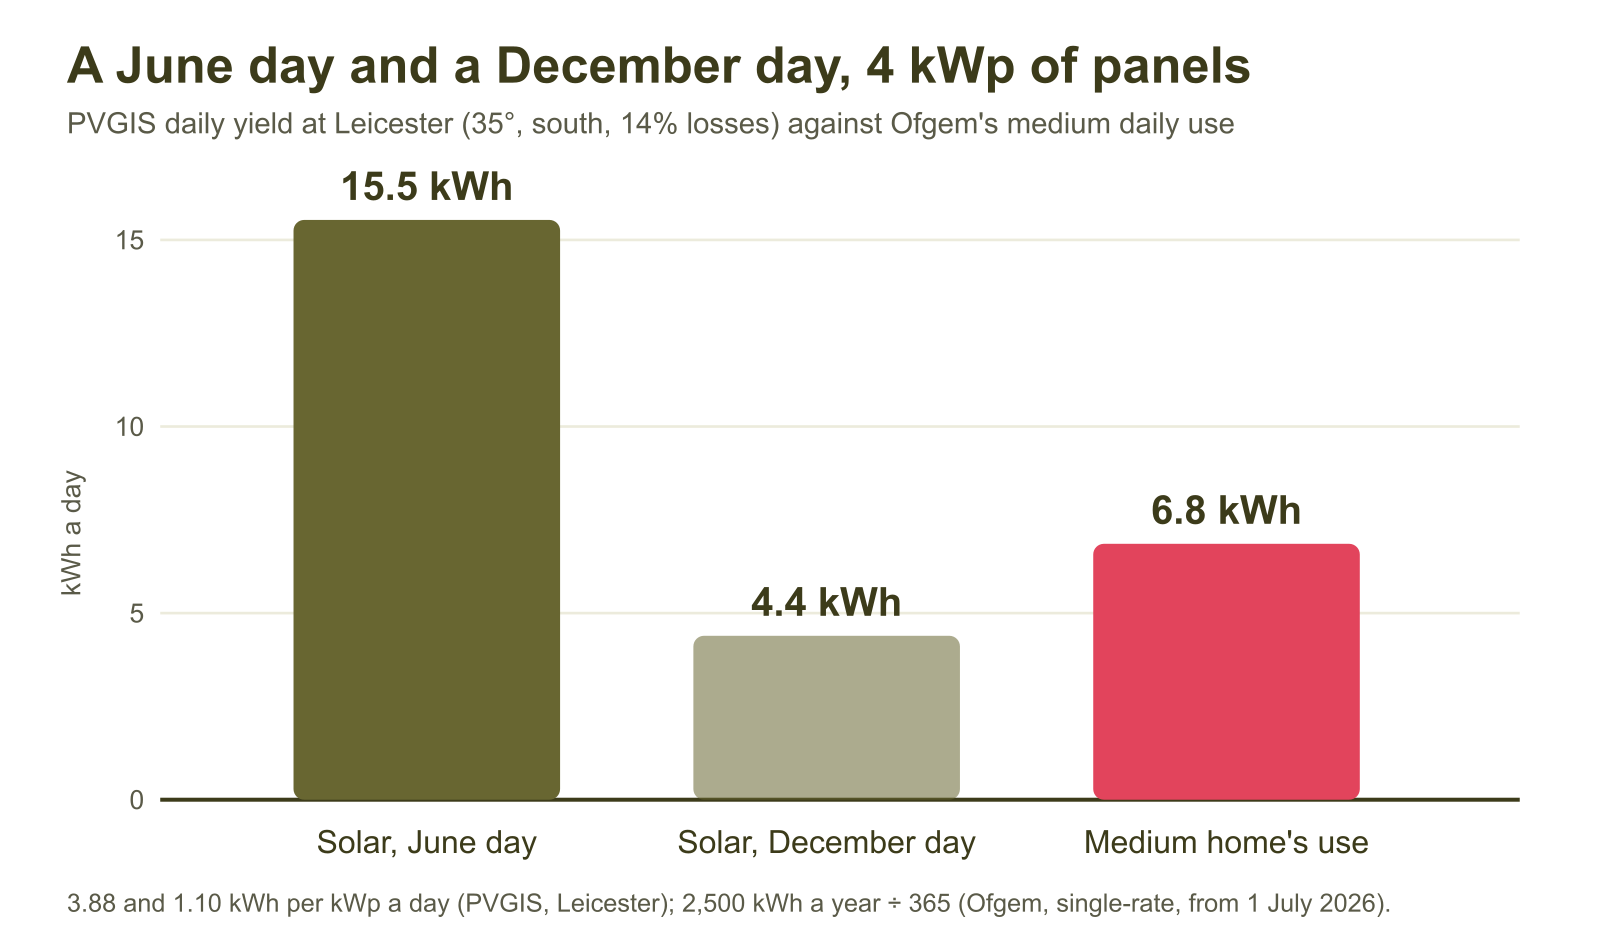
Daily output by array size
| Array size | June day | December day | Medium use a day |
|---|---|---|---|
| 2 kWp | 7.8 kWh | 2.2 kWh | 6.8 kWh |
| 3 kWp | 11.6 kWh | 3.3 kWh | 6.8 kWh |
| 4 kWp | 15.5 kWh | 4.4 kWh | 6.8 kWh |
| 5 kWp | 19.4 kWh | 5.5 kWh | 6.8 kWh |
| 6 kWp | 23.3 kWh | 6.6 kWh | 6.8 kWh |
Leicester's profile is the only monthly one we have read, so treat these as an example of the pattern, not your home's figures. Yearly totals vary by place too: on the same settings, PVGIS gives about 814 kWh per kWp in Bangor, 886 kWh per kWp in Manchester, 965 kWh per kWp in Liverpool, 968 kWh per kWp in Birmingham, 981 kWh per kWp in Leicester, 1042 kWh per kWp in Cardiff. Your installer's quote should give an annual estimate for your own roof.
What the seasons mean for a battery
Summer: plenty to store, often more than fits
On a long June day a 4 kWp array makes far more than a medium home uses. A battery fills, often by early afternoon, and the rest is exported. The battery then runs the evening. This is when a battery does most of its work, and also when a bigger battery adds the least, because the extra capacity would only catch more of a surplus that is exported anyway.
Spring and autumn: the battery's best seasons for usefulness
In the shoulder months, surplus and evening use are often similar in size, so a sensibly sized battery fills and empties most days. That is the pattern a good size aims for.
Winter: little or nothing spare
On a December day the same array makes less than the house uses, so almost everything is consumed as it is made. A solar-fed battery may barely charge for weeks. If you want storage to work through winter, the realistic options are charging from the grid in a tariff's cheaper hours, or accepting that the battery's year is mostly April to September. Charging from the grid explains the first in kWh.
Using this when sizing
The seasons are the strongest argument for sizing from evening use rather than from summer surplus. A battery that matches your evening use will fill most days from spring to autumn and still empty every evening. A battery sized to swallow every June afternoon will sit partly unused for much of the year.
If you have panels already, last year's export is the best evidence of how much surplus you get. Look at it month by month if your supplier or app shows it: the summer months will dwarf the winter ones. Then use the sizing helper with your own figures, and the explorer on the home page to see what a quote's self-use estimate means across the year.
For how a battery behaves hour by hour on different kinds of day, see how a solar battery works; for adding storage to a system you already have, storage for existing panels.
Reading your own seasonal pattern
If your supplier or smart meter app shows monthly export, the pattern will usually look like a hill: low in November to February, rising steeply in spring, high from May to August and falling away in autumn. The height of that hill in each month is the most a solar-fed battery could have stored. Many monitoring apps for existing solar systems also show daily generation, which lets you count how many days in a month the surplus would have filled a battery of a given usable size. Your own numbers are better than any example, because shading, roof angle and habits all change the shape.
What this means for backup in winter
Power cuts are more likely in winter storms, which is exactly when a solar-fed battery has least in it. If backup matters to you, a reserve setting that keeps part of the battery back, and the option to top it up from the grid when a storm is forecast, matter more than raw size. Backup in a power cut explains the runtime arithmetic.
What this page is based on
Questions about storage in your own home?
Tell us a little about your home and what you want a battery to do. Your message reaches SEO-DONS LTD, which publishes this guide, and we answer by email. It costs nothing to ask and commits you to nothing.
What happens next
- SEO-DONS LTD, the publisher of this storage guide, reads your message.
- We answer by email, using the same sources as the guide.
- What you do next, if anything, is up to you.